Store KPI Dashboard for Excel

Know which store is off target — and why.

Paste your daily POS sales and see every store's targets, growth, ATV, UPT and conversion — plus the key driver behind each result and what to do about it.

Up to 20 stores Any currency Excel & Google Sheets No traffic counter needed
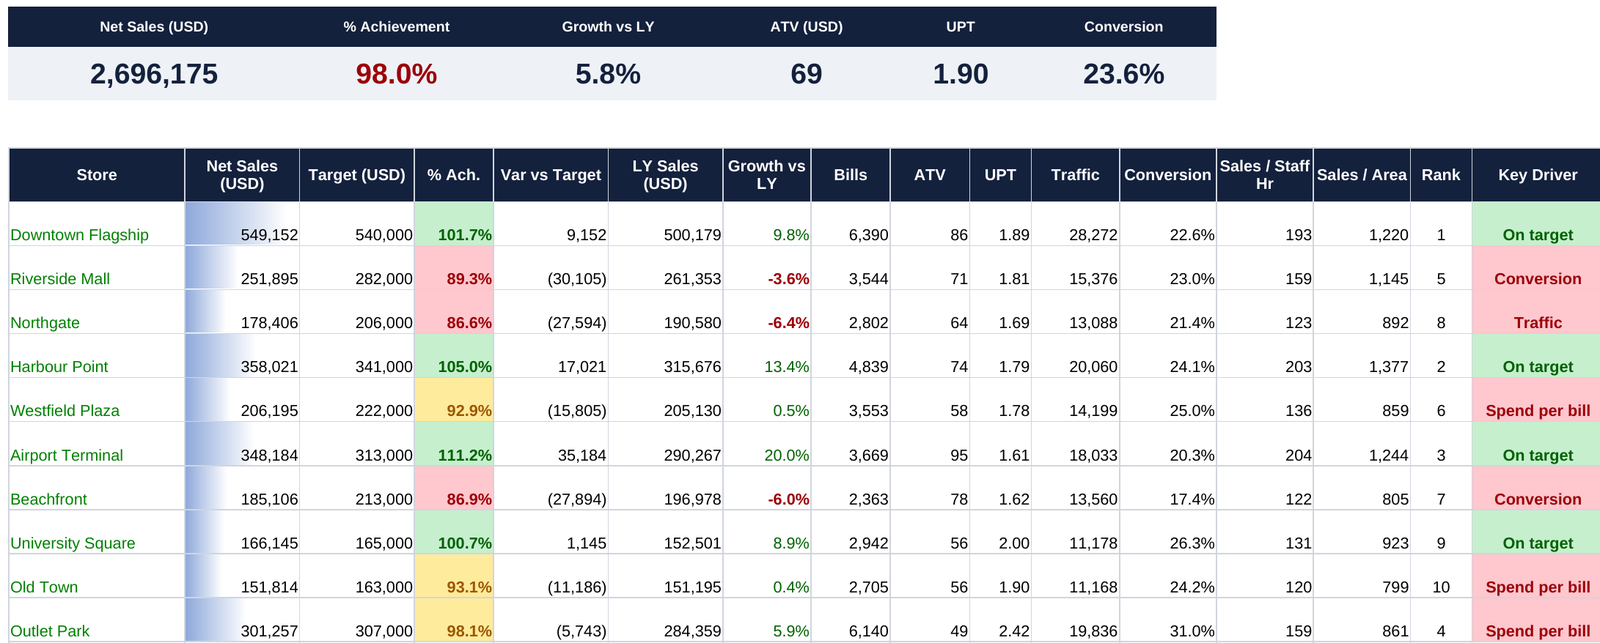
Store KPI Dashboard showing KPI cards and a store table with key drivers
The problem

"Sales are down at that store."
But why?

Most multi-store owners can see when a store misses target. Few can see the reason — and each reason needs a completely different fix.

Traffic

Fewer people walk in

Fix with local marketing, window display, events and mall partnerships.

Conversion

They walk in but don't buy

Fix with staffing at peak hours, availability of key sizes, and selling skills.

Spend per bill

They buy, but spend less

Fix with add-on selling, bundles, price mix and smarter promotions.

Sales = Traffic × Conversion × Spend per bill
What you get

Built by a retail operations leader,
not a spreadsheet designer.

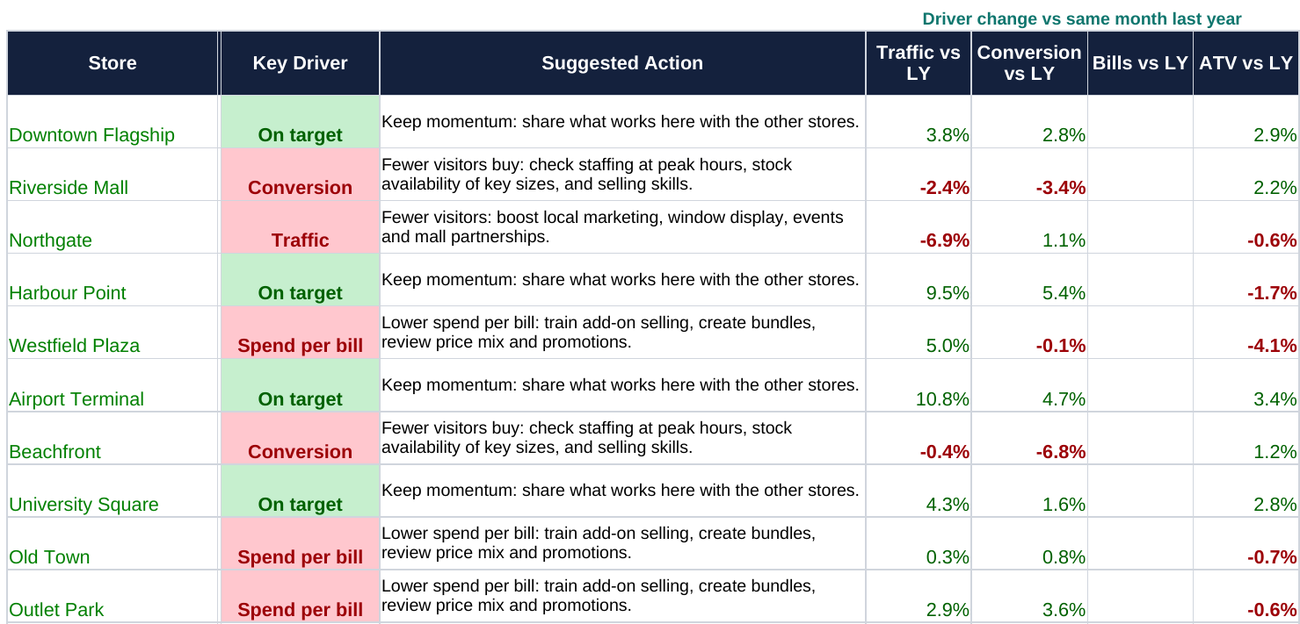
A key driver and next action for every store

The dashboard compares traffic, conversion and spend per bill with the same month last year, names the one that fell most, and suggests a practical action.

  • Works without a traffic counter (uses transactions instead)
  • Color-coded: on target, close, or off target
  • Actions written from real store experience
Key driver and suggested action for each store
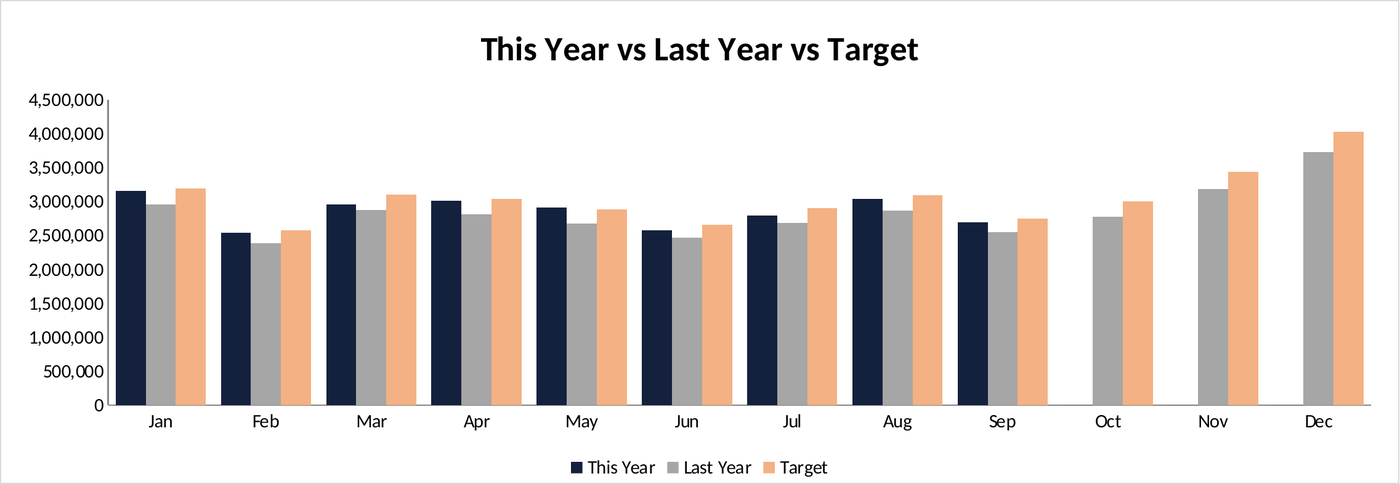
12-month chart of this year vs last year vs target

The full year at a glance

Month-by-month sales for every store, compared with last year and target, with charts that update themselves.

  • % to target and like-for-like growth
  • ATV, UPT, conversion, sales per staff hour and per sq m
  • Store ranking and a sales vs target chart
Setup

Ready in 10 minutes. No formulas to write.

1

Add stores & targets

List up to 20 stores, enter monthly targets and pick your currency.

2

Paste POS data

Daily sales, bills and units per store. Traffic and staff hours are optional.

3

Pick a month

Everything — KPIs, ranking, charts, key driver — updates automatically.

4

Act on it

Focus each store on the one thing that will move its sales.

Pricing

Start free. Upgrade when you're ready.

One-time purchase. No subscription. Instant download.

LITE

$0
Free, forever
  • Up to 3 stores
  • KPI cards & store table
  • Sales vs target chart
  • Sample data included
Download free
FULL VERSION

Store KPI Dashboard

$29 one-time
Approx. ฿1,000 · instant download
  • Up to 20 stores
  • Key driver analysis vs last year
  • Suggested action for every store
  • 12-month trend vs last year & target
  • Any currency
Buy now — $29

Secure checkout by Lemon Squeezy. Prices in USD; your card is charged in your local currency.

Questions

Do I need a traffic counter?

No. Without traffic data the dashboard analyses transactions and spend per bill instead. If you start counting visitors later, conversion analysis switches on automatically.

Which software do I need?

Microsoft Excel 2010 or later on Windows or Mac. The file also opens in Google Sheets.

How many stores and how much data?

The full version handles up to 20 stores and about 2.7 years of daily data. The free LITE version handles 3 stores.

Is it a subscription?

No. You pay once and keep the file. The licence covers use within one business.

Is the file in Thai?

The template itself is in English and works in any currency. It includes sample data so you can see exactly how it works before entering your own numbers. Support is available in Thai or English.

What if it doesn't work for me?

Email hello@vantraretail.com and we'll help you set it up. Try the free LITE version first to make sure it fits your data.
Stop guessing. Start with the free version.

Download the LITE dashboard, paste a month of sales, and see your stores in a new way.